Report Designer Part 3
Parts 1 and 2 of the report designer explained the overhead concepts needed to create reports. This part discusses the actual creation of the report.
TYPES OF REPORTS
Your first consideration is what kind of document is it that you want to create. Office Express allows you to create the following documents:
NOTE: Each type of document must be saved with a file extension for that type of document. Huh? We'll get to that in a bit.
Customer Form Letters, used for collection letters, new season contracts and any other document that will print one page per customer. These documents are designed in both free form and tabular styles. The extension for these documents is .doc.
Reports, obviously by the name, used for designating reports. These documents print as many customers and customer data as can print on a page. These documents are almost always done in the tabular style. The extension for these documents is .rpt.
Invoices, the invoice documents. These documents are used for printing your customer bills. These files are always in tabular style. The extension for these documents is .inv.
Proposals, the proposal documents. These documents are used for printing your customer proposals. These files are always in tabular style. The extension for these documents is .pro.
Workorders, these documents define how your workorders will print. These files are always in tabular style but print one page per customer. The extension for these documents is .wo.
Route Sheets, these documents are used for printing your route sheets. Unlike workorders, as many customers as can fit on a page will print. These files are always in tabular style. The extension for these documents is .rte.
Job Notices, these documents are used by companies that need to notify customers in advance of the job. Mostly these companies use chemicals at the job site and the customer must be notified in advanced. These files are always in tabular style. The extension for these documents is .not.
Workorder Notice/Invoice, these documents are the documents that print with your workorders and are left at the job site notifying the customer what jobs were completed. These documents also double as an invoice if the jobs are billed at the time of service. These files are always in tabular style. The extension for these documents is .woi.
SAVING YOUR DOCUMENT FOR THE FIRST TIME
When saving your document you will select the file type by selecting the extension from the Files of type: drop down list in the save document dialog box as seen below:
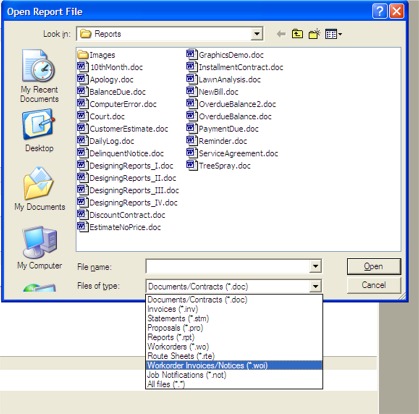
1. click File from the main menu
2. click Save As...
3. the dialog shown above will be displayed
4. type in the name for your document in the File name: box
5. click the Files of Type: drop down box and select the type of document
you want this document to be
6. click OK.
NOTE: You only use the Save As... option the first time you save the document. Use the Save option every time after that.
EDITING AN EXISTING REPORT
You can change and edit any of the reports listed on the Office Express Reports page. To edit one of these reports:
1. go to the Reports page by clicking the Reports icon in the navigation bar
at the top of the Office Express window.
2. the list of pre-designed reports will be visible, move to the report you want
to change
3. click the right mouse button on the report.
4. select the Edit Report in Designer option.
DESIGNING A REPORT
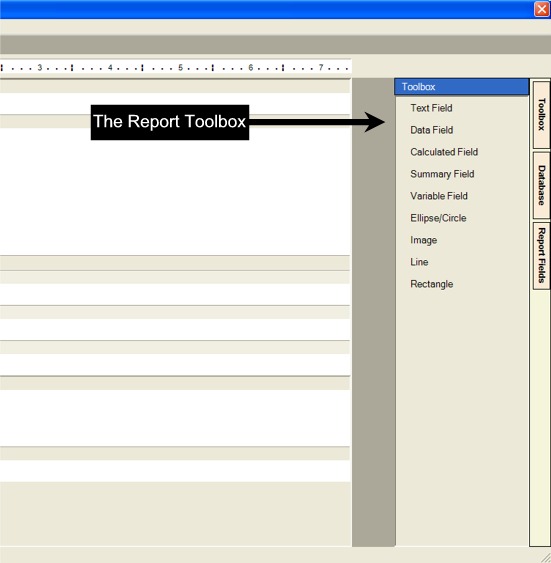
Along the right edge of the report designer window are three tabs: Toolbox, Database and Report Fields. When you move the mouse over a tab a "toolbox" will be displayed.
The Toolbox tab contains tools that are not data related such as boxes, lines, images and text. The Database tab contains the tools needed to "pull" customer information from the database. The Report Fields toolbox contains tools specific to the report such as Date, Time, Page # and so on. Everything that you will place onto your report will come from these toolboxes.
POPULATING THE DESIGNER WITH REPORT FIELDS
As mentioned above the toolboxes to the right of the designer window contain all the tools you will need to create a report. The report designer gives you great
flexibility in creating a report. With the available tools you can easily create eye-popping documents that are sure to impress your customers.
To place a tool on the designer's canvas, simply open the toolbox by moving the mouse over the tab for the toolbox, press left mouse button down and while holding the left button down, "drag" the tool to the spot you want the tool to be placed. You don't have to be exact in your positioning. You can move it to its precise location later.
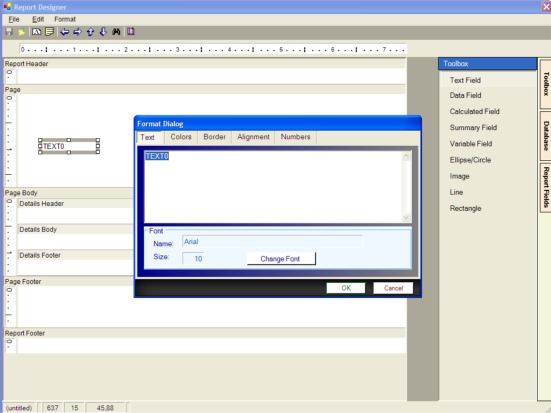
- In this example a new text field has been placed in the designer and a dialog box is now displayed allowing you to define the text, font, color, border and alignment.
Depending on the tool you selected a dialog box might be displayed asking you to further define what you want to appear on the report at print time. For example, if you placed a text field on the report, the dialog will ask you for font, color, border and alignment information. You can get really creative with the choices available to you. When you select a database tool, which is simply a table in the database, you will need to choose the piece of information you want tot print like last name, first name, etc. Notice in the yellow box below the customer you selected to print this report for last name printed.
Though you can do it any way you choose, we find that the fastest way to create a report is to "drag" most if not all of the fields onto the designer canvas
first without worrying about exact positioning and formatting. You then
"tweak" the positioning, add coloring, borders and so on.
Once your fields are placed on the canvas then you can move them to their final position by clicking the left mouse button on the field and while holding the left button down move the field to the desired position. All fields have this property.
NOTE: For precise positioning, you can use the arrow keys on your keyboard to "nudge" the field into position.
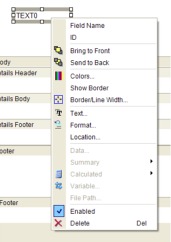
To further define your field you can right-click the mouse button on the field to view a menu of options that assist you in describing how you want the field to look.
To resize a field, click on the field with the left mouse button. The field will be surrounded by a box. Each corner of the box will have a small square that when you move the mouse over it allows you to "drag" the box. When you drag the box you can control the height and width of the field.
Once you have used the designer for a few minutes you'll notice that the designer gives you the ability to design your reports exactly how they will look at print time. The only difference between the designer and the printed report is the printed report will contain "real" data. The data fields you place in the designer from the toolbox are simply place holders for the actual data that gets printed.
Though designing a report is quite easy, in the beginning you should examine the
pre-designed reports and documents to get a clear insight of how the designer works in translating your design into a printed document.
Let's examine the CAPUSLE.INV invoice that comes with Office Express and is one of the more complex designs.
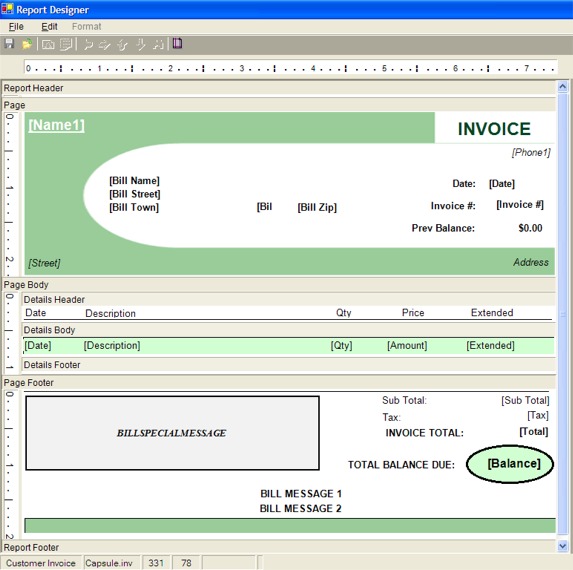
First off this is a tabular report, notice the Details Header, Body and Footer in the Page Body.
Now let's examine the design from Top to bottom:
- Being the is a design used for invoicing a report header is not necessary and the report header area has been closed.
- Below the Report Header is the Page area. Above the page body is the Page Header. The header contains: A graphic image (the pale green background is actually an image stored on your hard drive), a text field for the word INVOICE, data fields for your company information, data fields for the customers billing address, a date field and a data field for the invoice #.
- The Page Body: The Details Header contains text fields for the headings of the columns that will print. This heading only prints once per page. In the Details Body are the customer transaction data fields for the invoice. To get the green background, a rectangle was placed behind the data fields and colored pale green. All the data fields were also given the same green background. The Details Footer has been closed and is not necessary in this context.
- The Page Footer: The BILLSPECIALMESSAGE, BILL MESSAGE 1 and BILL MESSAGE 2 fields are Variable fields pulled from the Toolbox. The remaining data fields are from the invoice table, except for the [Balance] field which comes from the customers table. Finally an ellipse was placed behind the [Balance] field and colored pale green.
- The Report Footer area has been closed because in this context it is not necessary.
To go to Designing Reports Part 4 click here...
Home | Getting Started | Table of Contents | Report Design Part 1 | Report Designer Part 2 | Report Designer Part 4