Pagebreaks, Report Groups and Sorting
You will need to use the special PAGEBREAK field for documents where many items will be printing for each customer. Let's examine the DiscountContract.doc that came with Office Express to illustrate this point:

This document will print the services scheduled for each customer you select. The Report Designer is using a tabular report style, if you are not familiar with this, reread sections one and two on the Report Designer.
In tabular style, at print time, the report engine is going to print as many items as it can on a page. In the above example, we want to have all the jobs for each customer to print on a page, but only one customer per page. Notice the PAGEBREAK command in the above image. Without the PAGEBREAK command, the report engine will start printing the next customers jobs on the same page because it is looking to fill the page.
The PAGEBREAK tells the report engine to stop printing jobs on this page when the last job for the current customer has printed. There is one more item of note that you will need to understand, the use of a report Group in the above image.
Notice the two dark gray areas labeled: Group Header: Customers->ID and Group Footer: Customers->ID.
This tells the report engine to "group" scheduled jobs together by the customer id. In the group footer are summary fields that calculate the totals for the customer that just printed. Summary fields were discussed in a previous section so we won't cover them here but what is important is where they are placed in the designer.
The Group Header is the area BEFORE scheduled jobs start printing, the Group Footer is the area AFTER the last scheduled job has printing for the customer. Obviously, you would want to summary and totalizers to print after the customer's jobs have printed.
When the Group Footer has been reached, all the jobs for the customer have printed. This is the place that you put your PAGEBREAK command. Notice in the image above, the PAGEBREAK is after the summary fields. When the report engine reaches the PAGEBREAK command, it knows not to print anymore jobs on the page and then drops down to print the page footer to complete the page.
To use the PAGEBREAK command:
- click on the Report Fields label on the right edge of the designer window
- when the toolbox is displayed, click on Pagebreak and drag it to the position you want it.
USING REPORT GROUPS
Report Groups allow you to group data together on data fields you choose. For example when printing a completed job report you could create a report group for the Date field. This would group and sort all the completed jobs by the date they were completed.
Report Groups also give you header and footer areas where you can place column headings and group totals. Continuing with the Completed Job report example, if you define a group for the Date field, you can then use summary fields in the group footer to print totals for price and tax, thus giving you totals from day-to-day.
You can also put report groups inside report groups. Again, using the Completed Job Report example, you could place a Report Group for the Crew field inside the Date group. This now enables you to calculate totals for each crew for each date if you have more than one crew.
Notice how this is done in the image below...
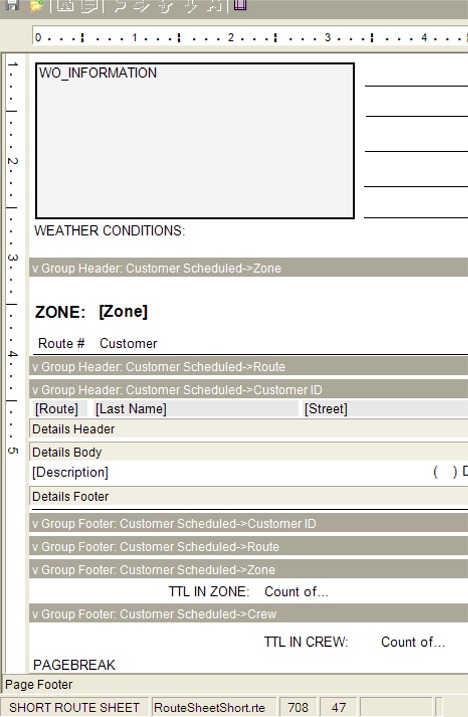
This image was taken from the Short Route Sheet that came with Office Express. Let's analyze the use of report groups in this document.
NOTE: This document is probably as sophisticated as you'll get when creating reports. When you understand this document you're ready to create some very powerful reports.
1. The report is in Tabular style, the presence of the Details Header, Body
and Footer make it tabular.
2. At the very top of the report, not seen in this image is the report group for
the Crew field (you can see the Crew footer at the bottom of the image).
3. Everything at the top of the report until the group heading for the zone
field "belongs" to the Crew group heading. This means that everything
above the Zone group will print each time a new crew is encountered.
4. Next is the group heading for the Zone field. The fields inside this heading
will print for each zone
5.Next is the group heading for the Route field. This field is included simply
to force the report engine to sort the data records by the route #. This ensures
that the customers print in the proper route order.
6. After the route group, a Customer ID group is defined. This group is needed
to make sure all jobs for the same customer print together if the customer is
scheduled to get more than one job.
7. Next are the Details Header, Body and Footer. The fields needed to print
information about the scheduled job prints here.
8. The Customer ID group footer is next. Nothing is placed in this footer
because the group was used only to group customer jobs together.
9. Next is the Route Group Footer. Again, nothing is placed in this footer
because the group was used solely for sorting.
10. The Zone group footer comes next. Notice the TTL IN ZONE: Count of...
summary field. This field will print the number of customers that printed in
that zone.
11. The last group footer is the Crew Group Footer. This has the same summary
field as the Zone footer. The summary field will print the total number of
customers listed in the crew. NOTE: You could also place a summary field for the
Price field that would print the total gross for the crew.
12. Finally there is a PAGEBREAK in the Crew footer. This tells the report
engine that this page is done and to start a new page for the next crew.
There's a lot there, but it is straight forward and logical. For most cases you won't need to create documents as complex as the one above, but if you learn to understand it, you have the power to use the Report Designer to it's fullest.
SIMPLE SORTING AND FILTERING
Office Express allows you place a simple sort without having to use Report Groups. You can access the sort by:
1. clicking the File option from the main menu
2. click the Document Setup... option
3. click the Data Tables tab.
4. a dialog box like the one below will be displayed.

In this example, a sort on the Customer Invoice table has been added and a Filter on the Customers table was defined. This would be ideal for a report where you wanted a listing of all customer invoices for only customers who have an outstanding balance. The invoices would print sorted by date as defined above.
This dialog box with it's sorts and filters allows you to do many powerful things in and of itself. Take the time to learn Row Filters because Office Express uses this features in many areas of the program.
Click here to learn about Row Filters...
Home | Getting Started | Table of Contents | Report Design Part 1 | Report Designer Part 3 | Report Designer Part 4 | Report Designer Part 5 |